Securitized Products Notes From the Desk (March)
Non-Agency RMBS – Michael Hsu
Interest rates were once again in focus as the reflation theme gained momentum on the back of trillions in fiscal stimulus, commentary from FOMC members reassuring the market they would stay on course, and the ongoing rollout of COVID vaccines. With the selloff in rates (the 10yr U.S. Treasury touched 1.77% intraday on March 30, a post-pandemic high), Non-Agency RMBS were unevenly impacted. Legacy bonds remained well supported, with demand coming from real money accounts driven by solid housing fundamentals. Spreads were steady, with longer duration passthroughs trading range-bound in a swaps plus 140 to 160 basis point (bps) range. In RMBS 2.0 sectors, however, certain segments were negatively impacted by the rates move. Their spreads widened based on expectations of higher mortgage rates leading to slower prepayment speeds. Additionally, Credit Risk Transfer subordinate bonds widened on elevated extension risks. To quantify: CAS and STACR B1s and B2s ended the month generically off of the local tights (early February) by 75-100 bps and 150-175 bps, respectively.
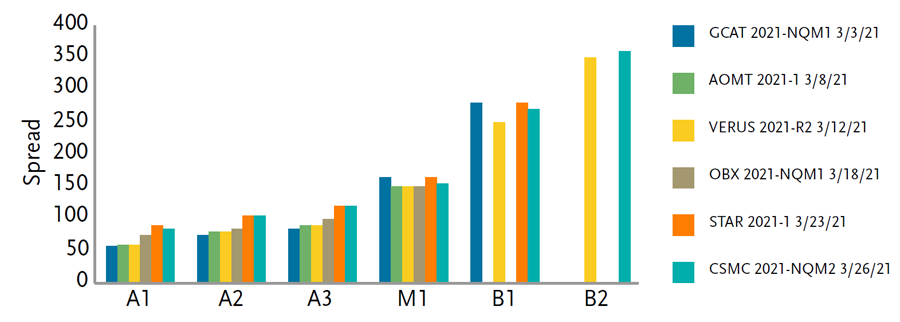
The primary calendar was active throughout March and proved to be another source of pressure on spreads within RMBS 2.0, particularly in Non-Qualified Mortgage (“Non-QM”) deals where the path of widening was most observable. Total monthly issuance increased from $9 billion in February to $12 billion in March. Of that $12 billion, almost $2 billion came from six Non-QM transactions. The brisk pace of new issue in Non-QM weighed on spreads in senior bonds more acutely than in subordinate bonds, as is illustrated in the chart below showing deals issued in March. Spreads on the capital structure bear flattened where the A1 through A3 seniors priced progressively wider from swaps +58 on the AAA rated A1 at the beginning of the month to swaps +85 towards the end. Meanwhile, investors in search for incremental yield kept spreads on mezzanine and subordinate profiles mostly unchanged.
Source: TCW
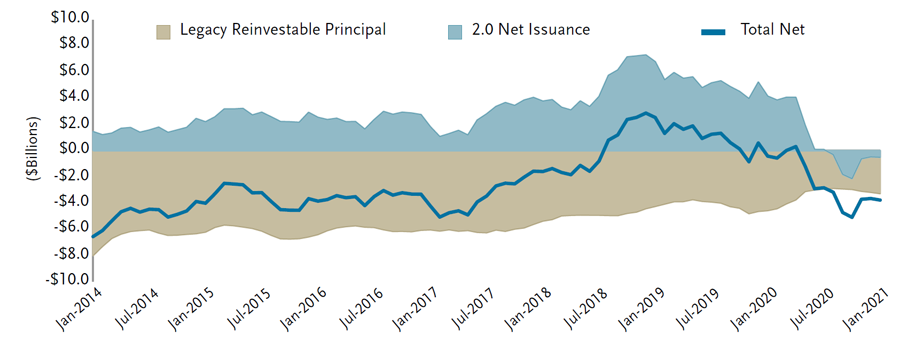
While RMBS 2.0 issuance rebounded during March, net issuance still hasn’t recovered to levels seen prior to the pandemic. From 2018-2020, the Non-Agency market grew in size for the first time since 2008. This was, in large part, due to the expansion of Non-QM and RPL (re-performing loan) programs. With the pandemic putting a pause on programmatic issuance and Non-QM origination, that trend reversed course last year and the market is once again experiencing negative net issuance and declining in size. The ongoing rebound in new issue hasn’t been able to offset declines due to elevated prepayment speeds spurred by record low mortgage rates and upward trending legacy deal redemptions. As a result, the technical landscape remains supportive.
Source: Morgan Stanley
CMBS – Sagar Parikh
After several months of spread tightening, March finally reversed course with spreads widening at the top of the conduit CMBS capital structure. The CSAIL conduit transaction in late March priced at swaps +83 bps, the widest new-issue level since early December. Cash AAAs ended the month 7-10bps wider, after largely outperforming IG corporates during the first two months of the year. Lower in the stack, spreads were mixed, with AA/A paper drifting wider in sympathy to the move in AAAs and anything with a lower dollar price or below IG relatively flat on strong demand for higher-yielding opportunities.
Single Asset, Single Borrower (SASB) and Commercial Real Estate CLO (CRE CLO) secondary BWIC volumes were moderate this month, with $1.45 billion out for the bid. Most of the market’s supply came through the new-issue market, with five CRE CLO transactions pricing during the month. The elevated supply weighed on spreads at the top of the capital stack with a TRTX transaction pricing at 120 DM for the AAAs, materially wider than the 85 DM prints on the MF1 and PFP deals which priced the beginning of the month. In the SASB market, six floating rate transactions priced during the month as investors have shown a strong preference for floating-rate transactions. Pricing levels down the stack, particularly in SASB office, were 25-50bps wider than initial guidance as the uptick in sublease space continues to thin out demand for the sector.
On the remittance side, CMBS delinquencies fell to 6.89%. The delinquency rate has been consistently declining since June 2020, but the number of loans in special servicing has remained elevated. Some 30 loans, totaling $690 million, transferred into special servicing during the month, as more loans from seasoned 2010-2012 vintages entered special servicing prior to maturity. Meanwhile, 26 loans became newly modified in March, as loans exiting their forbearance period were able to come up with permanent modifications with special servicers after agreeing to maintain interest reserves or paying down partial principal balances. JPM provided a helpful transition matrix for loans that had previously received forbearance (conduit/SASB loans in general received much shorter forbearance periods than the transitional loans in the CRE CLO space, which will need a much longer period of time to build up their reserves).
CMBS Forborne Loan Expiration – As of March 19, 2021

Source: J.P. Morgan, Trepp
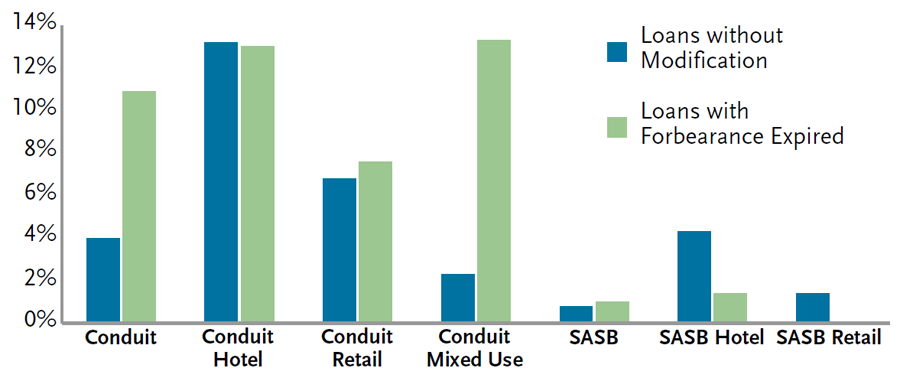
Of note, SASB loans have held up extremely well coming out of forbearance. Conduit loans, meanwhile, have seen more loans become seriously delinquent. Only 1.4% of SASB hotels have become delinquent coming out of forbearance as compared to conduit hotel default rates which have remained above 10%. Most SASB loans are backed by institutional borrowers who have been able to tap either the unsecured credit market or various forms of financing to hold onto their assets, while many smaller conduit borrowers have limited financing options or are unwilling to re-invest the equity to see their properties make it through this cycle.
60d+ Delinquency Rates (Incl. FC/REO and NP) for Loans Without Modification Versus. Loans With Forbearance Expired by Deal and Property Type
Source: J.P. Morgan, Trepp
ABS – Tony Lee
March marked the one-year anniversary of COVID-19 stay-at-home orders throughout the United States. In sharp relief, nearly $60 billion in new issue ABS has priced year to date, a 27% increase from 2020. The pace of new issue ABS slowed in March, with only $7.2 billion pricing. The first few weeks of the month started out in convincing fashion, with Global Jet Capital pricing a $663 million private aircraft ABS at swaps + 155bps for single-A rated senior bonds. The deal was heavily oversubscribed across all three tranches and priced 45bps to 100bps inside initial price guidance. Similarly, Travel and Leisure’s (formerly known as Wyndham) $500 million timeshare ABS and Toyota’s $2.13 billion 5yr revolving prime auto loan ABS saw fervent demand. Towards the latter part of March, however, the sell-off in rates caused market participants to pause and reevaluate. Longer duration ABS spreads leaked wider with Textainer pricing its $600 million container ABS at swaps + 125bps for 5yr bonds. This was roughly 15bps wider than Triton’s TCF 2021-1, which came at swaps+110bps for 5.5yr bonds in February.
A full year into COVID-19, consumer credit has held up fairly well. Massive federal government stimulus, lender payment relief programs, and prudent consumer behavior have all played a part. Delinquencies in subprime auto, bank credit cards, retail credit cards, and both traditional and marketplace consumer unsecured loans have mostly trended lower in both month-over-month and year-over-year terms while prime auto delinquencies have largely remained flat (exhibit below). Annualized net loss rates are down over 250bps in subprime auto and unsecured consumer loans year-over-year.
Delinquencies

Source: INTEX, Barclays Research
Annualized Net Loss Rates

Source: INTEX, Barclays Research
CLO – Palak Pathak
Secondary
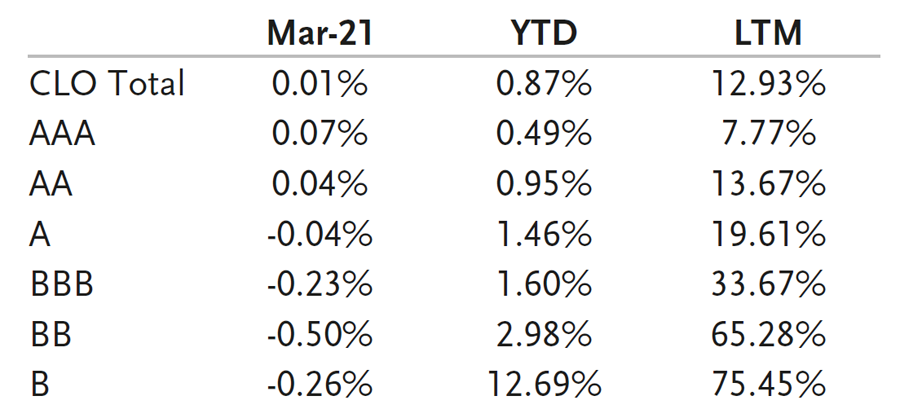
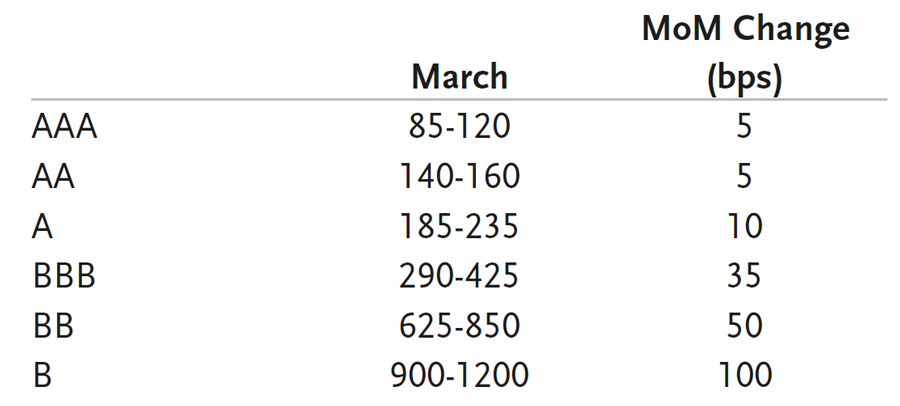
CLO returns were flat over the month with CLO AAA spreads widening 5-10bps as heavy primary supply and higher rates caused
some investors to pause and re-assess the fixed income landscape. As rates rose, fixed rate alternatives began to look more
attractive versus floating rate CLOs. With short end rates, including 3 month LIBOR, continuing to remain at their lows due to Fed
policy, CLO AAA all-in yields became less attractive to yield based investors. Shorter, out of reinvestment, AAA spreads were flat
over the month with most bonds trading in the 80s DM context. Longer AAA spreads, however, widened out 5-10bps to 110-120
DM with many bonds now back to discount dollar prices. AAs and single As also widened 5-10bps with the majority of AAs trading
in the 150-160 DM range versus 140-150 DM in Feb. Single-A bonds followed suit with most trading in the high 100s DM. BBBs
and BBs saw the most widening over the month. BBB spreads were anywhere from 25-50bps wider depending on the profile. Many
BBB buyers are also rate sensitive and thus when rates rose over the month, we saw increased selling with BWIC volumes almost
60% higher versus February. In addition, heavy new issue supply weighed on spreads as many investors did not have room to add
more BBBs (as they were full from prior purchases). As such, spreads moved into the mid/high 300s DM by the end of the month
versus low 300s earlier in the month. BB spreads were also 25-50bps wider, mainly due to higher primary supply. CLO equity
prices remain well supported with loan prices stable along with reduced tail risk from manager trading and increased
refi/reset optionality. In addition, cash-on-cash payments remain high with the LIBOR floor benefit continuing to accrue to the
equity. Overall secondary activity was unchanged from the month prior with $3.1 billion in BWIC volume and a total of $12.4
billion trading per TRACE. IG/Non-IG volume was split 65%/35% with customers getting net longer in non-IG.
Primary
Primary volume declined in March to $14 billion in new issuance (from $16 billion in February). However, if you include
refi/reset activity, March volume surpassed $50 billion, one of the highest monthly new issuance volumes on record. Q1 volume
(ex. refi/reset) totaled $38.1 billion, the second highest quarter in terms of issuance outside of Q2 2014. Primary spreads moved
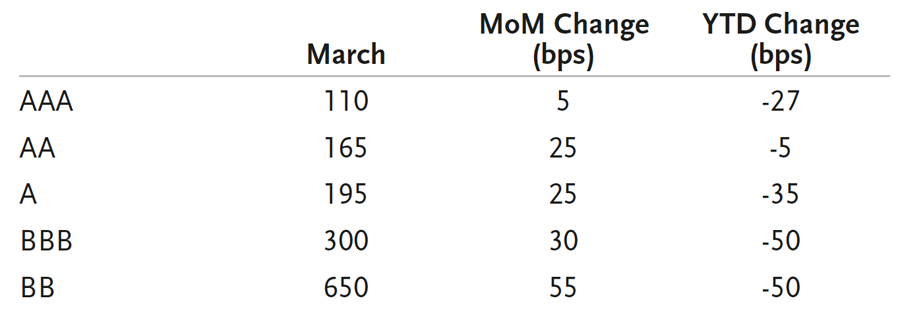
wider across the stack as the sheer volume of supply weighed on demand. As a result, primary AAA spreads widened 5bps with
full duration, Tier 1, deals pricing at 110 DM by month end. Shorter, refi AAAs widened from low 90s DM to mid/high 90s DM.
The rest of the stack was 25-50bps wider month over month as the buyer base for mezzanine bonds was thin.
The vast majority of new issue deals were structured as a 5nc2. Given the flatness of the AAA term curve, managers preferred locking in longer term financing versus a shorter reinvest structure. Notably, of the 29 deals that priced over the month, six were middle market CLOs. Given wider spreads, higher credit enhancement, and good performance during COVID, these middle market CLOs saw robust demand. The majority of middle market deals were issued with a 4nc2 structure with AAA spreads in the 160s DM.
Refi/Reset supply continued to be elevated with 44 refis and 30 resets pricing in March. As with primary spreads, refi/reset spreads were wider across the capital stack. Reset paper was noticeably weaker given par loss and lower enhancement levels. As spreads moved wider, we began to see more resets and new issues utilize a Sr/Jr AAA structure as managers sought to find ways to lower AAA funding levels.
Fundamentals
CLO fundamentals were a mixed bag in March as managers took advantage of the rally in CCC rated loans to reduce exposure.
As a result, the share of CCC rated loans further declined to under 7.5% for both Moody’s and S&P Caa/CCC rated loans. This
reduction improved Jr OC cushions in addition to WARF levels. On the flip side, however, the sales also created par loss as most
loans were sold below par. MV metrics declined as the share of loans trading over par declined with an increased amount of loan
refinancings. BB MVOCs declined 30bps to 105.9% and equity NAVs declined 4 pts to $54. In addition, CLO WAS declined by a
few bps, stemming from the effect of loan re-pricings.
Secondary CLO 2.0 Total Returns
Source: J.P. Morgan CLOIE Index
Secondary CLO 2.0 Spreads (DM)
Source: TCW
CLO New Issuance

Source TCW
Tier 1 New Issue Spreads (5nc2)
Source: TCW
Disclosure
This material is for general information purposes only and does not constitute an offer to sell, or a solicitation of an offer to buy, any security. TCW, its officers, directors, employees or clients may have positions in securities or investments mentioned in this publication, which positions may change at any time, without notice. While the information and statistical data contained herein are based on sources believed to be reliable, we do not represent that it is accurate and should not be relied on as such or be the basis for an investment decision. The information contained herein may include preliminary information and/or “forward-looking statements.” Due to numerous factors, actual events may differ substantially from those presented. TCW assumes no duty to update any forward-looking statements or opinions in this document. Any opinions expressed herein are current only as of the time made and are subject to change without notice. Past performance is no guarantee of future results. All investing involves risk including the potential loss of principal. Market volatility may significantly impact the value of your investments. Recent tariff announcements may add to this volatility, creating additional economic uncertainty and potentially affecting the value of certain investments. Tariffs can impact various sectors differently, leading to changes in market dynamics and investment performance. © 2025 TCW


