
No Such Thing as a Free Lunch
IG credit spreads were only marginally tighter in April, despite the euphoria exhibited in other risk markets. Sentiment is quite optimistic as an economic recovery and endless government stimulus overshadows higher taxes and more regulation – for the time being.
First quarter earnings are pointing to a strong recovery (+47% YoY earnings growth) as pent up consumer demand has been buoyed by government stimulus checks and excess savings. On its face, the return to pre-pandemic profitability should help corporations repair the damage done to leverage metrics. But credit fundamentals will be driven not only by the macro picture, but by the willingness of corporate management teams to exercise balance sheet discipline in the face of record low financing costs. M&A activity has already begun to accelerate and share buyback authorizations have eclipsed pre-pandemic levels. Central bank stimulus and yield suppression have propelled the leveraging cycle of the last decade. The longer the environment of cheap money and low volatility persists (until we get the next heart -stopping crisis), the less likely we are to see significant deleveraging. Presently, the cost of a ratings downgrade is modest as the A/BBB spread delta of 43 basis points (bps) has compressed to decade tights. The reflation/rotation trade has been largely realized as most of the COVID-impacted sectors are back to pre-COVID levels. The “technicals” have been good, no doubt: mutual fund inflows have been robust despite negative total returns and the pension rotation trade has created a strong bid for 30-year corporates. New issue volumes are robust but well absorbed and there is still $13+ trillion of negative yielding debt globally. But there is an asymmetric risk that exists as spreads compress towards their zero floor. At an Option-Adjusted Spread (OAS) of +83 bps over Treasuries, a lot of good news is already priced in. IG Credit spreads are well through historical averages (of +130 bps excluding recessionary periods) and just 2 bps shy of their post GFC tights (of +81 bps in Feb. ‘18). We find ourselves once again in a yield capture environment (versus spread compression). As such, the prudent strategy is to de-risk credit exposure by moving up the quality spectrum (given tight A/BBB relationships), reducing tight commodity-exposed names/sectors, swapping into shorter-dated maturities (where curves are flat) and picking liquidity.
IG credit index OAS of +83 bps over Treasuries near the post GFC tights. Yields still near historical lows:
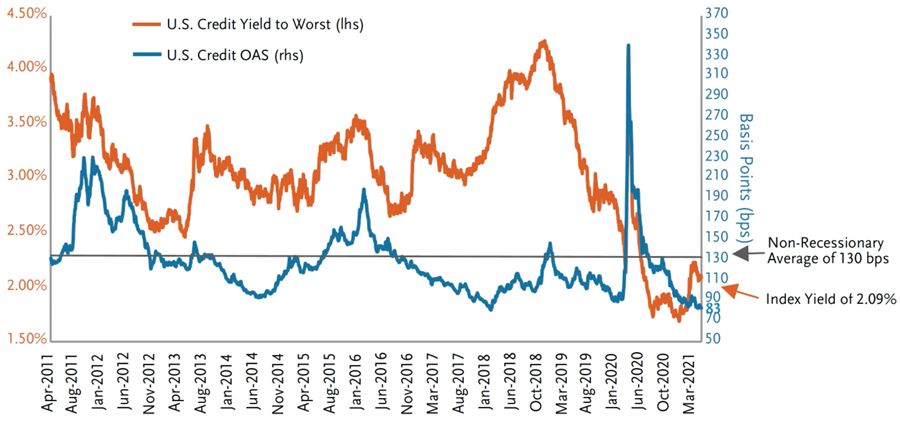
Source: Barclays, Bloomberg
Government spending spree: $10 trillion (45% of GDP) in announced stimulus over 13 months ($6 trillion already spent):
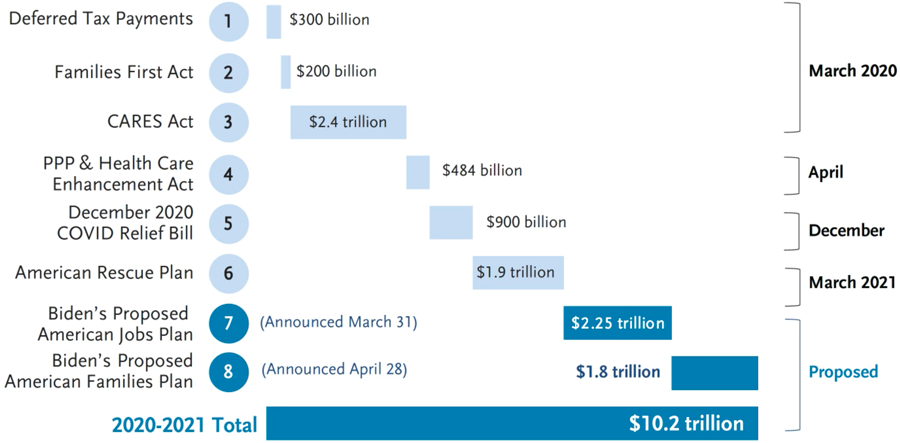
Source: MUFG, Committee for a Responsible Federal Budget, CBO.
No Free Lunch: The Taxman Coming
Biden proposal for higher corporate taxes:
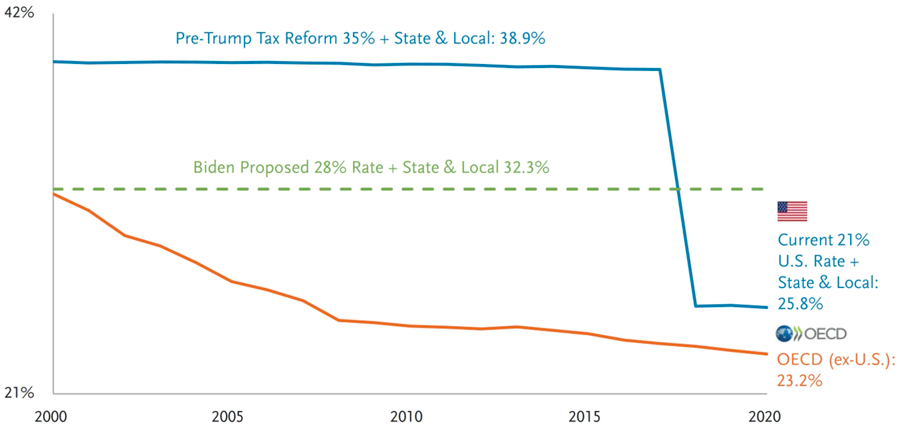
Source: MUFG, OECD. Tax rates include central and sub-central combined rates. OECD average excludes the U.S.
Biden capital gains tax increase proposal:
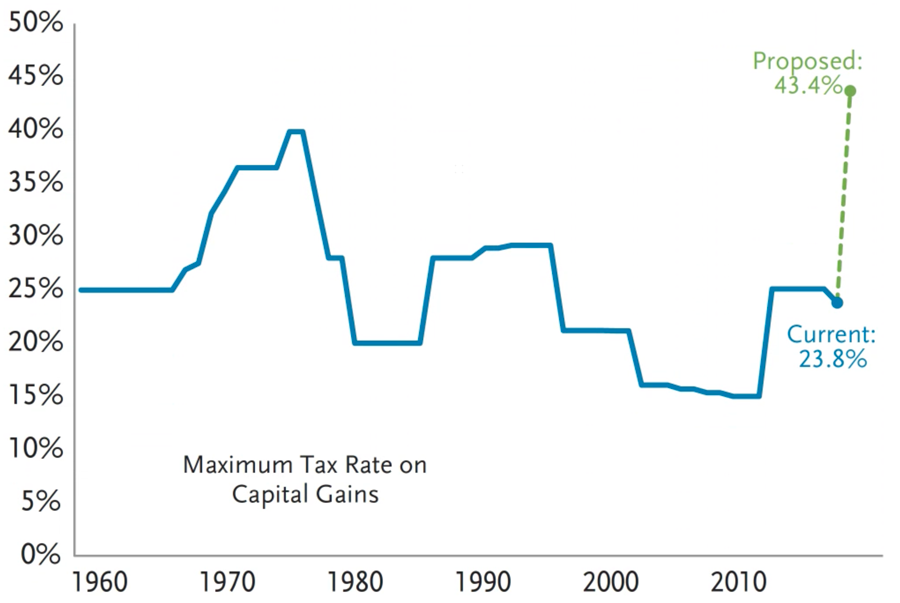
Source: Tax Foundation, Goldman Sachs Global Investment Research
Market Themes
- Q1 earnings growth of 47% is exceeding expectations and corporate sentiment is at all-time highs. Bank earnings were quite strong on robust capital markets activity and improving asset quality trends.
- The index OAS of +83 bps is hovering near decade tights. All but a few COVID-impacted sectors have fully remediated to pre-COVID spread levels.
- Significant credit curve flattening: demand for 30-year corporate bonds has been buoyed by the pension rotation trade (pension plans looking to lock in their funding status with equities at the highs). The 10-30’s credit curve at 35 bps is well through historical averages.
- The A/BBB spread of 43 bps is the most compressed it has been in a decade.
- M&A activity is accelerating and share buyback authorizations have eclipsed pre-pandemic levels.
- Taxes, regulation, and inflationary pressures are overhangs. The Biden administration is working on tax proposals that would raise income taxes to 39.6% for the top marginal rate, increase capital gains taxes to 43.4% (inclusive of a surtax) and raise corporate taxes from 21% to 28%. Even if some of these proposals get watered down, taxes are likely going up.
Big Earnings Recovery
S&P 500 Earnings and Sales Growth Actual Plus Expected
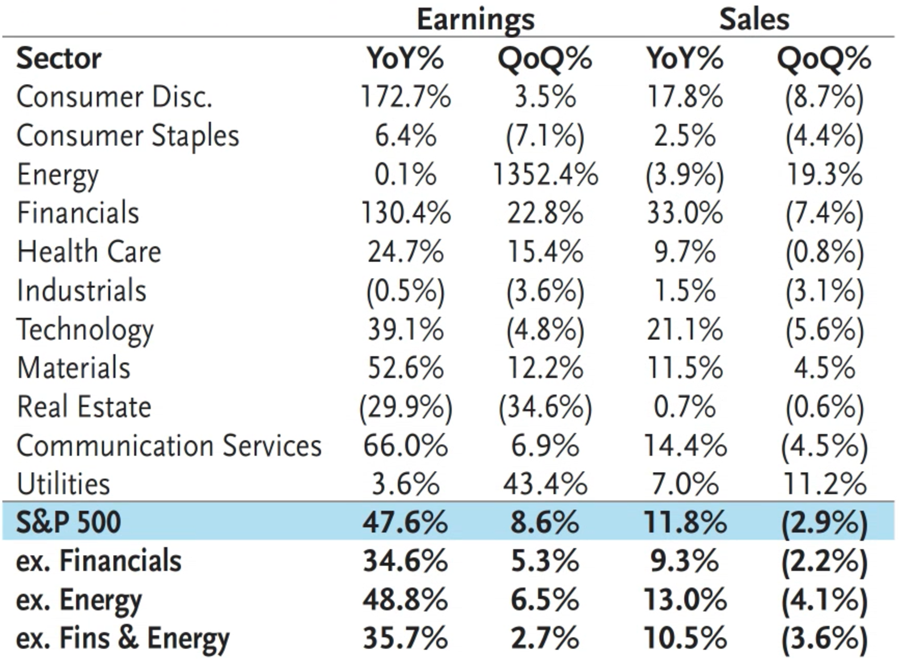
Source: FactSet, BofA, U.S. Equity & Quant Strategy
Corporate Sentiment at All-Time Highs
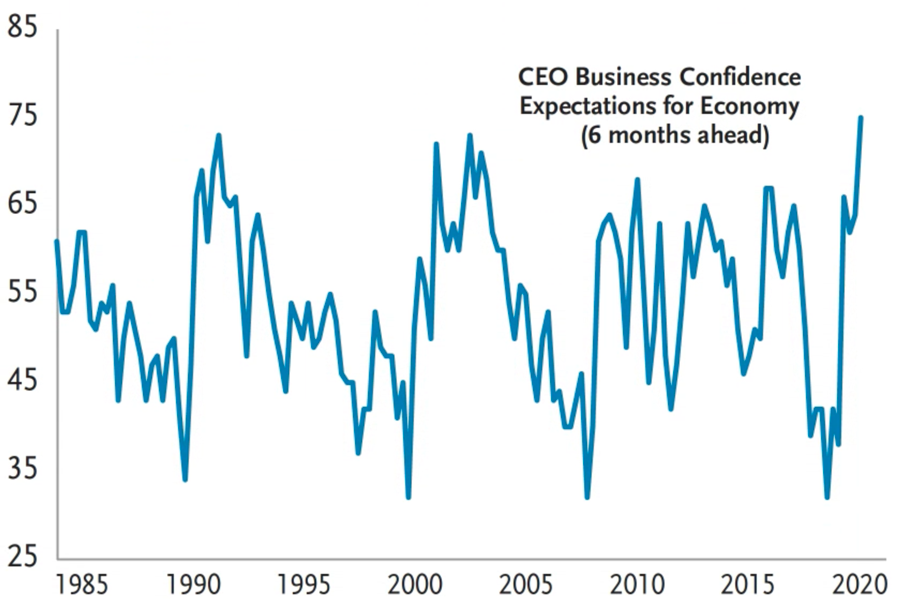
Source: The Conference Board, Goldman Sachs Global Investment Research
M&A activity is accelerating:
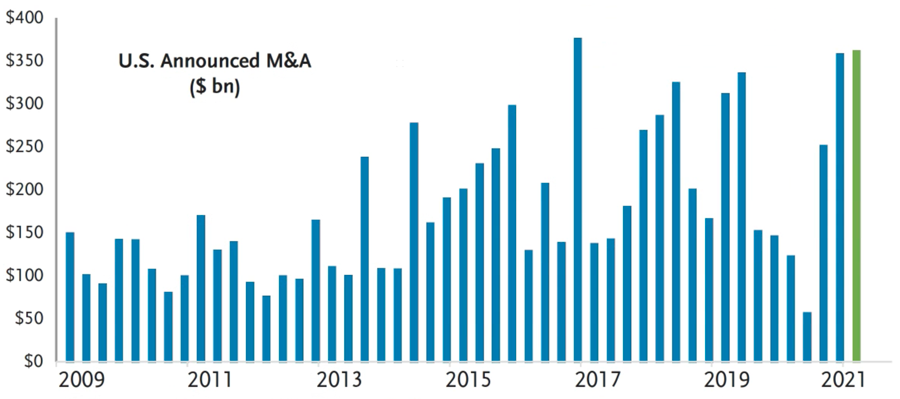
Source: Dealogic, Goldman Sachs Global Investment Research
Share buyback authorizations are surging (YTD through 4/26/2021):
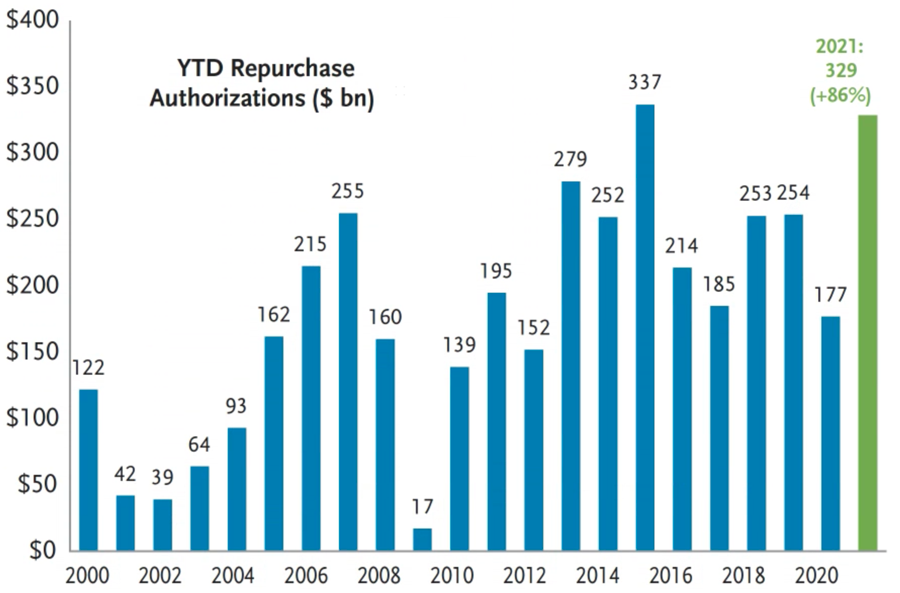
Source: GS Global Markets Division, Goldman Sachs Global Investment Research
Any way you slice and dice it, credit spreads are compressed by almost every measure.
Per Unit of Duration:
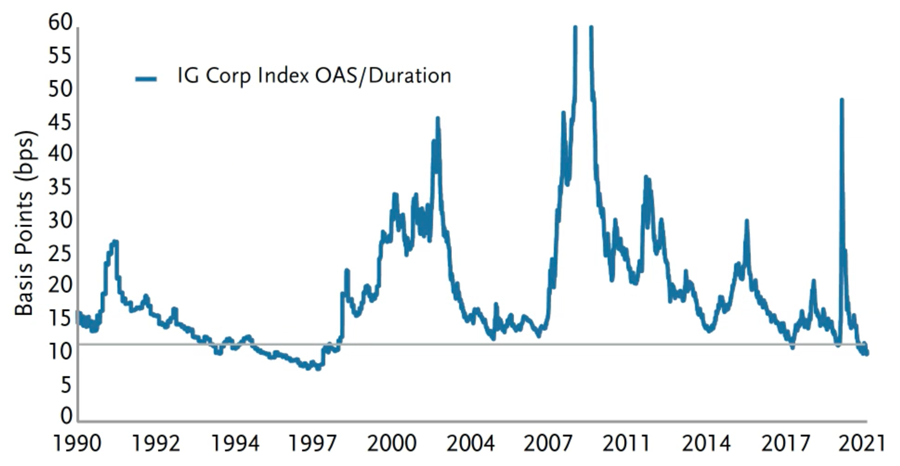
Source: Morgan Stanley, Bloomberg
By Ratings:
BBB-rated corporates have compressed versus A’s. At 43 bps apart, the relationship is at decade tights:
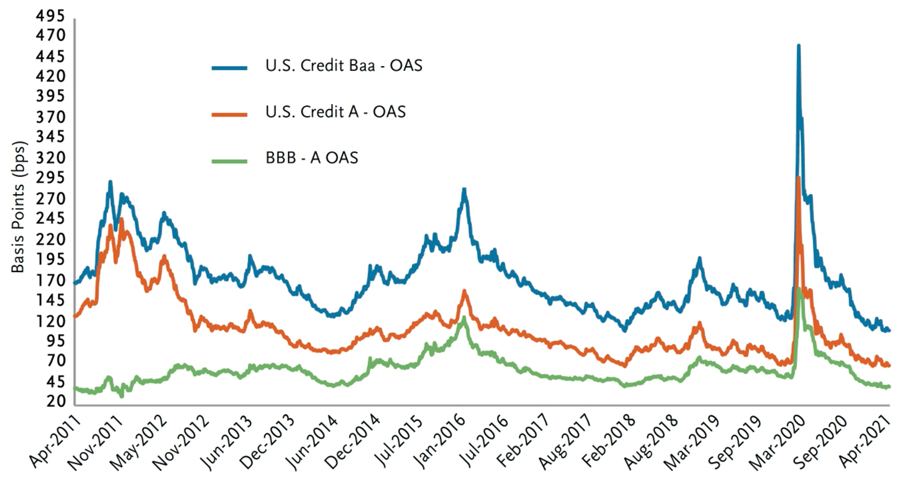
Source: Barclays, Bloomberg
Weighted average ratings of the corporate bond index shows continued degradation:
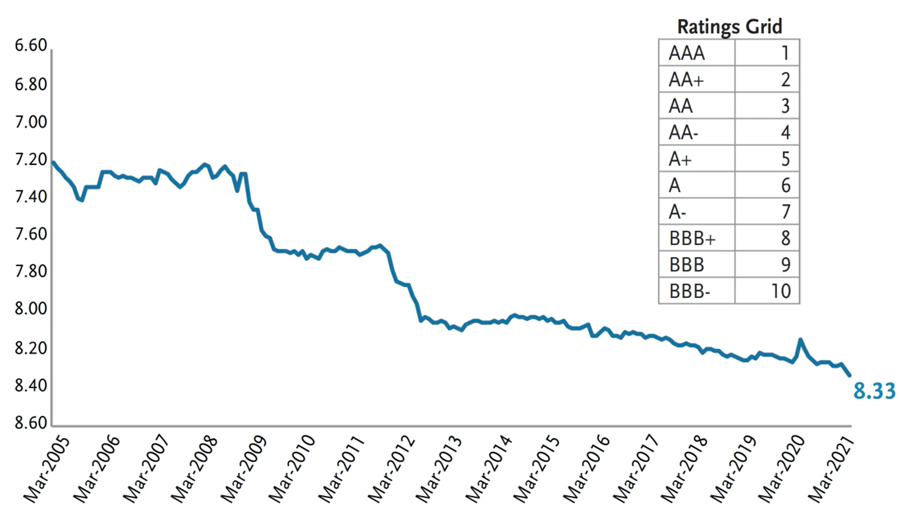
Source: Bloomberg
Index Performance Recap
The credit index OAS of +83 bps over Treasuries tightened 3 bps in April as valuations continued their march towards the post GFC tights (of +81 bps in Feb. 2018). The index yield of 2.09% was 10 bps lower on the month on lower risk free rates and marginally tighter spreads. This resulted in a total return gain of 1.06% in April, bringing the YTD total return to -3.44% (from -4.45%). The index yield touched the all-time low of 1.68% on 12/30/2020 and has averaged 3.06% over the last decade. Unambiguously, credit yields hovering around 2% are quite low, by historical standards. The long end marginally underperformed in April as credit curves experienced modest steepening. The exception was 20-year corporates which benefited from the upcoming change to the referenced Treasury benchmark. On May 3, all IG corporate bonds with maturities from 2037-2044 will roll to the 20-year Treasury versus the current 30-year Treasury benchmark. Now that 20-year Treasury issuance will occur on a regular and predictable basis, the change can be effectuated to help liquidity for 20-year corporate bonds by creating a more defined credit curve.
The pro-cyclical, COVID-impacted sectors outperformed, including airlines (-10 bps), REITS (-8 bps), independent energy (-7 bps), lodging (-7 bps), autos (-7 bps) and midstream (-5 bps). Increased mobility and demand recovery expectations drove the rally in the airline and energy sectors. Domestic airline passenger leisure volumes are recovering to pre-pandemic levels while business and international travel remain depressed. While profitability is not expected to return until business and international volumes improve, liquidity is strong across the sector and cash burn is remediating.
Energy outperformed with oil (WTI) rallying 7.5% to $63.5 as the supply/demand picture continued to improve. Over half of all commodity markets are currently backwardated, signaling a tighter/healthier supply picture. April 20 marked the one year anniversary of the unprecedented collapse in oil prices. Recall, a year ago (4/20/2020), WTI went negative (-$37) as oil demand plummeted and storage capacity reached its limit. We have come a long way since then and most of the cyclical and/or COVIDdisrupted sectors have now fully reverted back to their pre-pandemic trading levels.
The worst performing sector in April was tobacco (+11 bps), after negative regulatory headlines resurfaced. The FDA proposed a ban on menthol cigarettes and the Biden administration is considering requiring tobacco companies to lower nicotine levels in cigarettes sold in the U.S. Any actions require a multi-step, multi-year process that will require the FDA to gather and show scientific evidence that banning menthol and lowering nicotine levels are a net health benefit. Moreover, legal challenges/appeals from the tobacco companies could delay any action for years. Over the longer term, this could accelerate the transition to noncombustible alternatives that are deemed safer.
April Index Returns
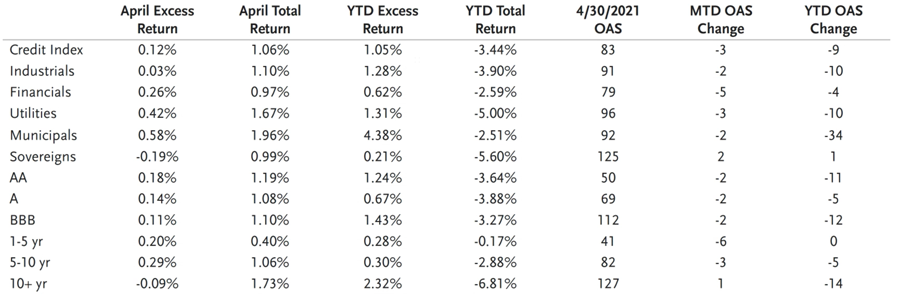
Source: Bloomberg
Many commodity markets are currently backwardated.
Front to Third Contract Implied Roll Yield, Annualized
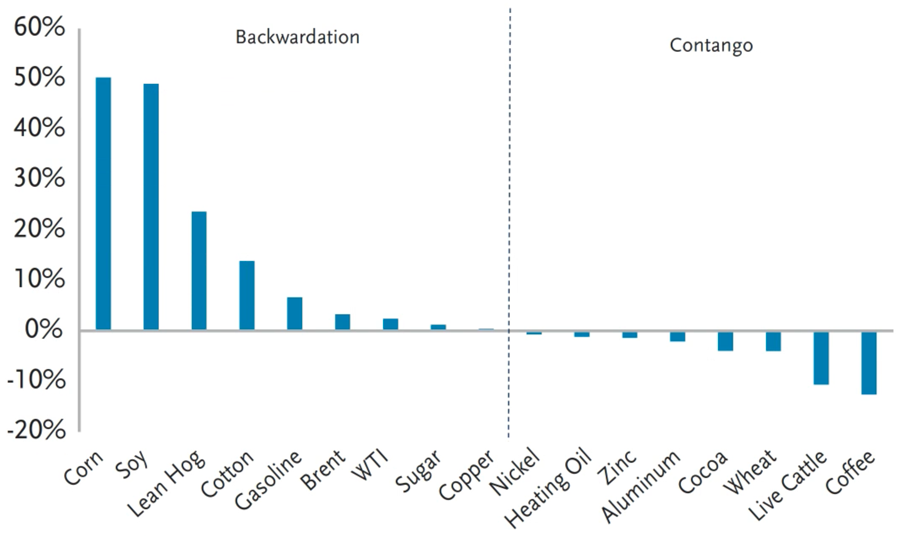
Source: Bloomberg, Goldman Sachs Global Investment Research
April and YTD Spread Changes
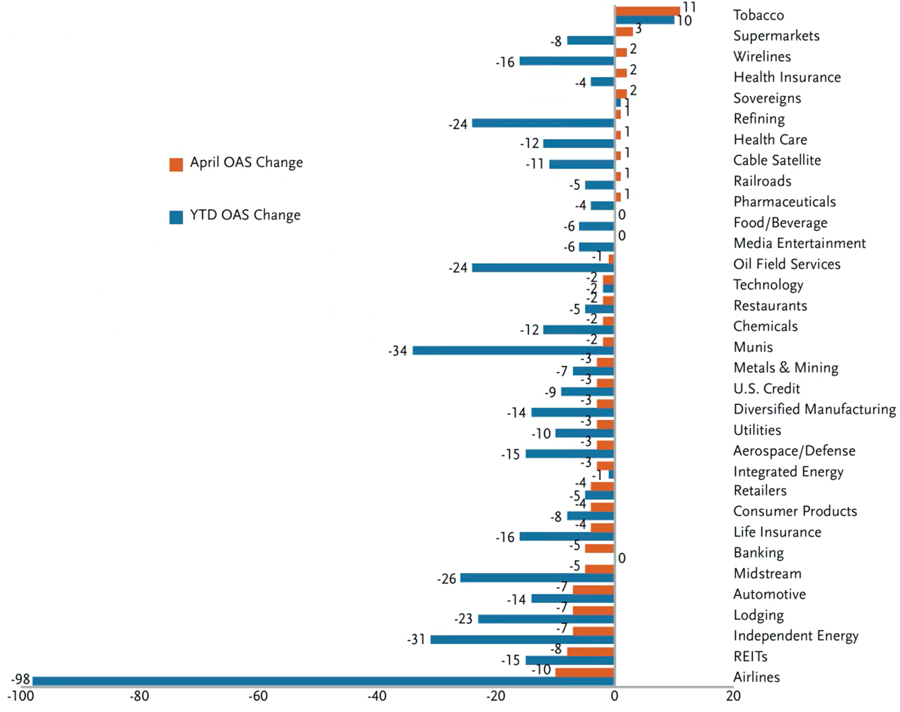
Source: Bloomberg
Current Spreads vs. Pre-Pandemic Levels
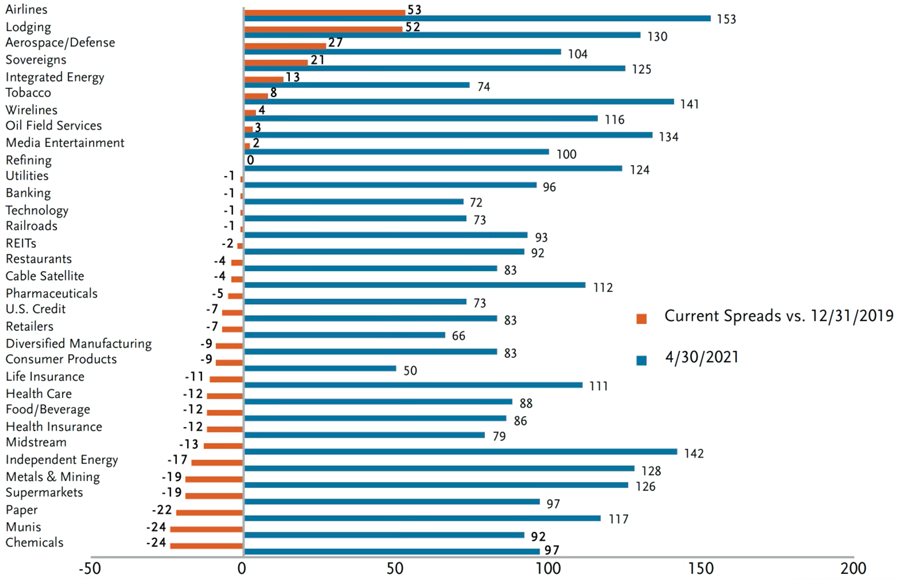
Source: Bloomberg
Cyclicals Have Compressed vs. Non-Cyclicals
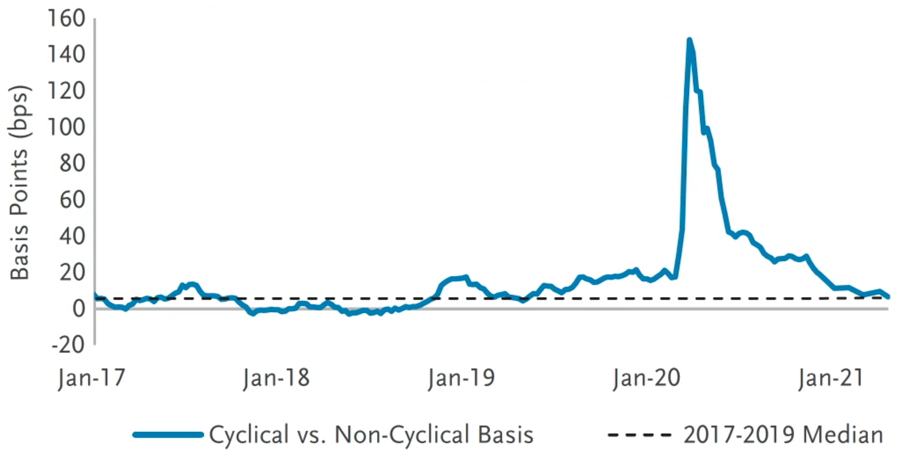
Source: Barclays
April Investment Grade Supply
April IG new issue volumes of $123.6 billions were comparatively lower versus the YTD monthly average of $146 billion. This brought YTD gross supply volumes to $584 billion, a 28% decrease versus 2020 but still 35% higher than 2019. Net supply (gross minus all redemptions) is $128 billion YTD which is down 73% versus 2020. M&A-related issuance was light at $6 billion though is expected to increase with the uptick in M&A announcements. Bank issuance of $58.7 billion accounted for almost half of April’s supply volumes, driven in part by the SLR exemption expiration. Several jumbo deals printed over three consecutive days, causing some volatility in spreads which translated into hefty new issue concessions (of 10-15 bps). The widening in spreads proved transitory as spreads for the sector ended the month tighter than where they began. Bank of America and JP Morgan priced the two largest bank deals on record: BofA issued $15 billion across 6 tranches (5 years priced at +90, 10 yrs at +110) while JP Morgan issued $13 billion across 5 tranches (5 yrs priced at +77, 10 yrs at +102).
Monthly U.S. IG New Issue Volumes (Gross)
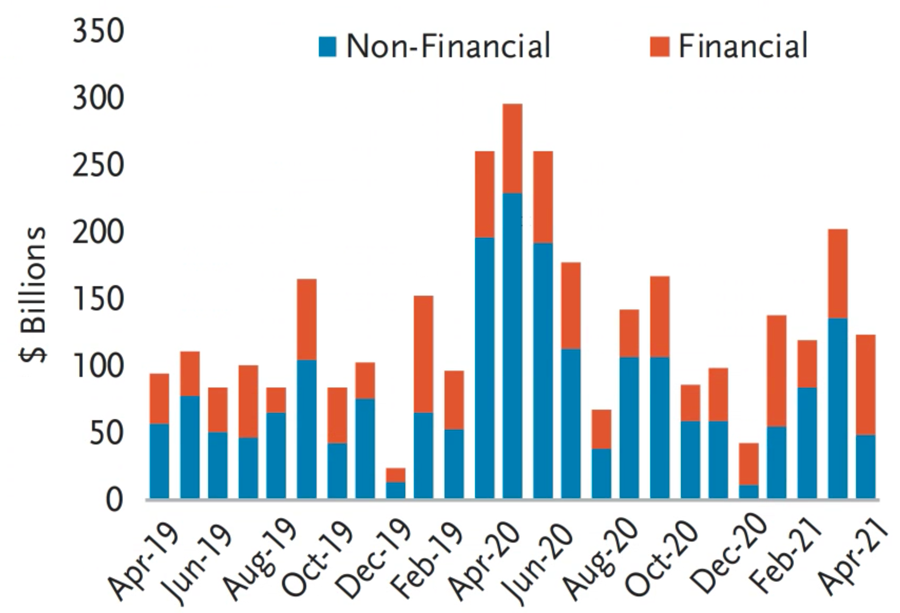
Source: Bloomberg, BofA Global Research
Monthly U.S. IG New Issue Volumes (Gross and Net)
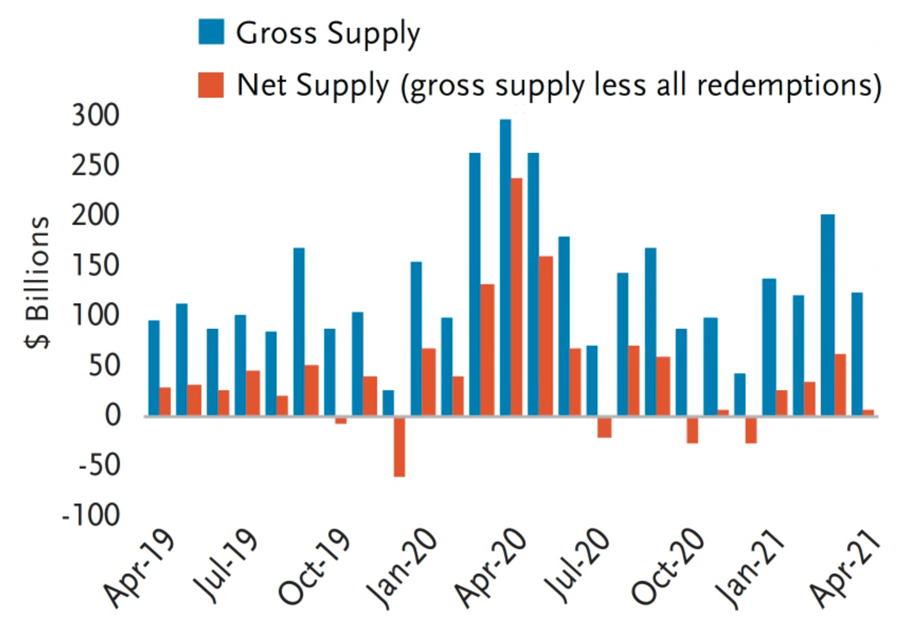
Source: Bloomberg, BofA Global Research
M&A-related volumes:
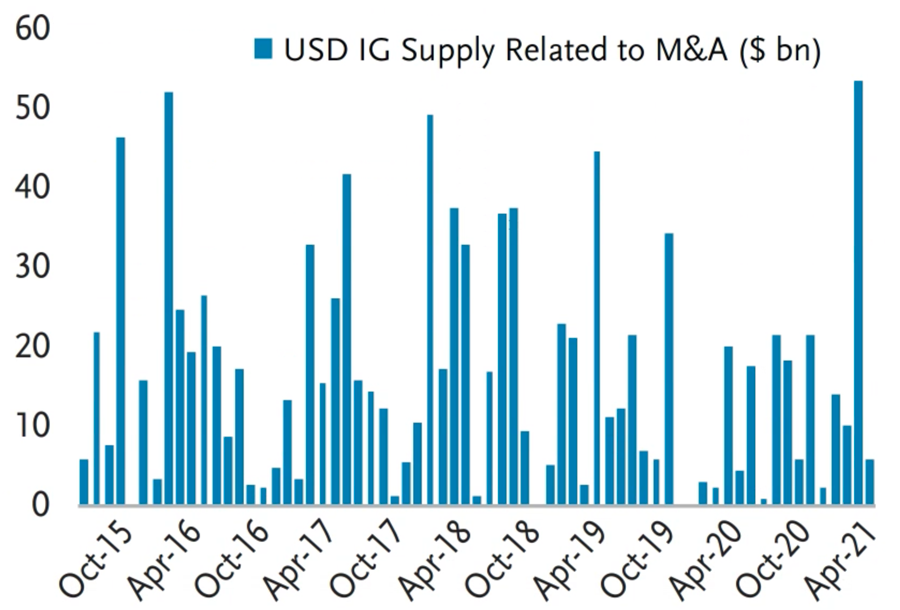
Source: Bloomberg, BofA Global Research
Largest pending M&A deals with funding implications:
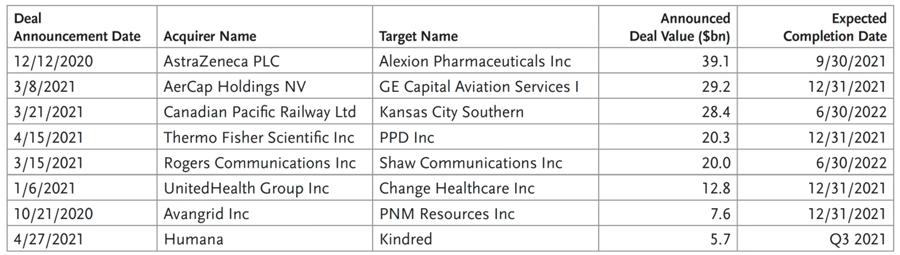
Source: BofA
Disclosure
This material is for general information purposes only and does not constitute an offer to sell, or a solicitation of an offer to buy, any security. TCW, its officers, directors, employees or clients may have positions in securities or investments mentioned in this publication, which positions may change at any time, without notice. While the information and statistical data contained herein are based on sources believed to be reliable, we do not represent that it is accurate and should not be relied on as such or be the basis for an investment decision. The information contained herein may include preliminary information and/or "forward-looking statements." Due to numerous factors, actual events may differ substantially from those presented. TCW assumes no duty to update any forward-looking statements or opinions in this document. Any opinions expressed herein are current only as of the time made and are subject to change without notice. Past performance is no guarantee of future results. © 2024 TCW